/
/
Greater Vancouver Real Estate Market – July 2025: A “Goldilocks” Recovery in Full Swing
Greater Vancouver Real Estate Market – July 2025: A “Goldilocks” Recovery in Full Swing
Greater Vancouver Real Estate Market – July 2025: A “Goldilocks” Recovery in Full Swing


Market Overview: Early Signs of a Comeback
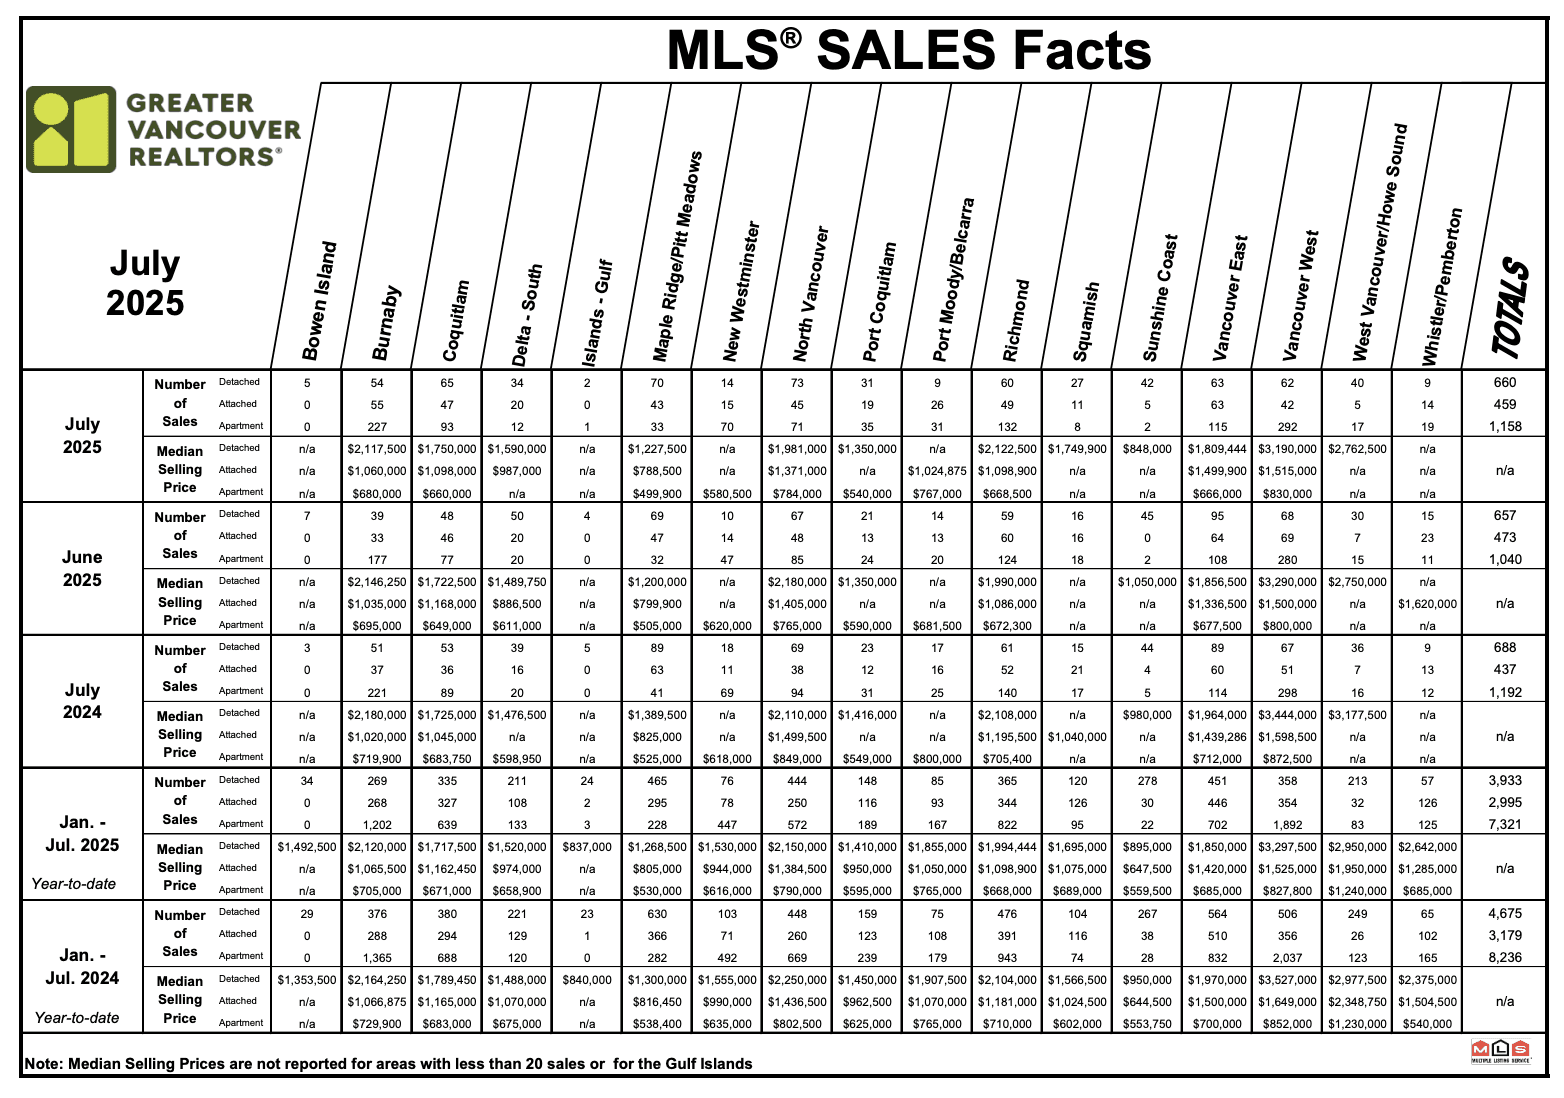
Greater Vancouver’s housing market is showing hints of a summer revival – not a full-on frenzy, but certainly a step up from the spring chill. Home sales in July 2025 totaled 2,286, just 2% shy of July 2024’s level, confirming the “early signs of recovery” that started to emerge in June. This minor year-over-year dip is practically a rounding error considering sales had been lagging far worse earlier in the year. To put it in context, July’s sales were still about 13.9% below the 10-year average for the month – so while we’re off life support, we’re not doing cartwheels just yet.
What’s fueling this cautious comeback? For one, the Bank of Canada hit the pause button on rate hikes in July, offering buyers and sellers a breather. This policy hold “could help bolster sales activity by providing more certainty” around borrowing costs. Add a dash of pent-up demand and you get a modest summer uptick in home buying.
Inventory and New Listings: Plenty of Options for Picky Buyers
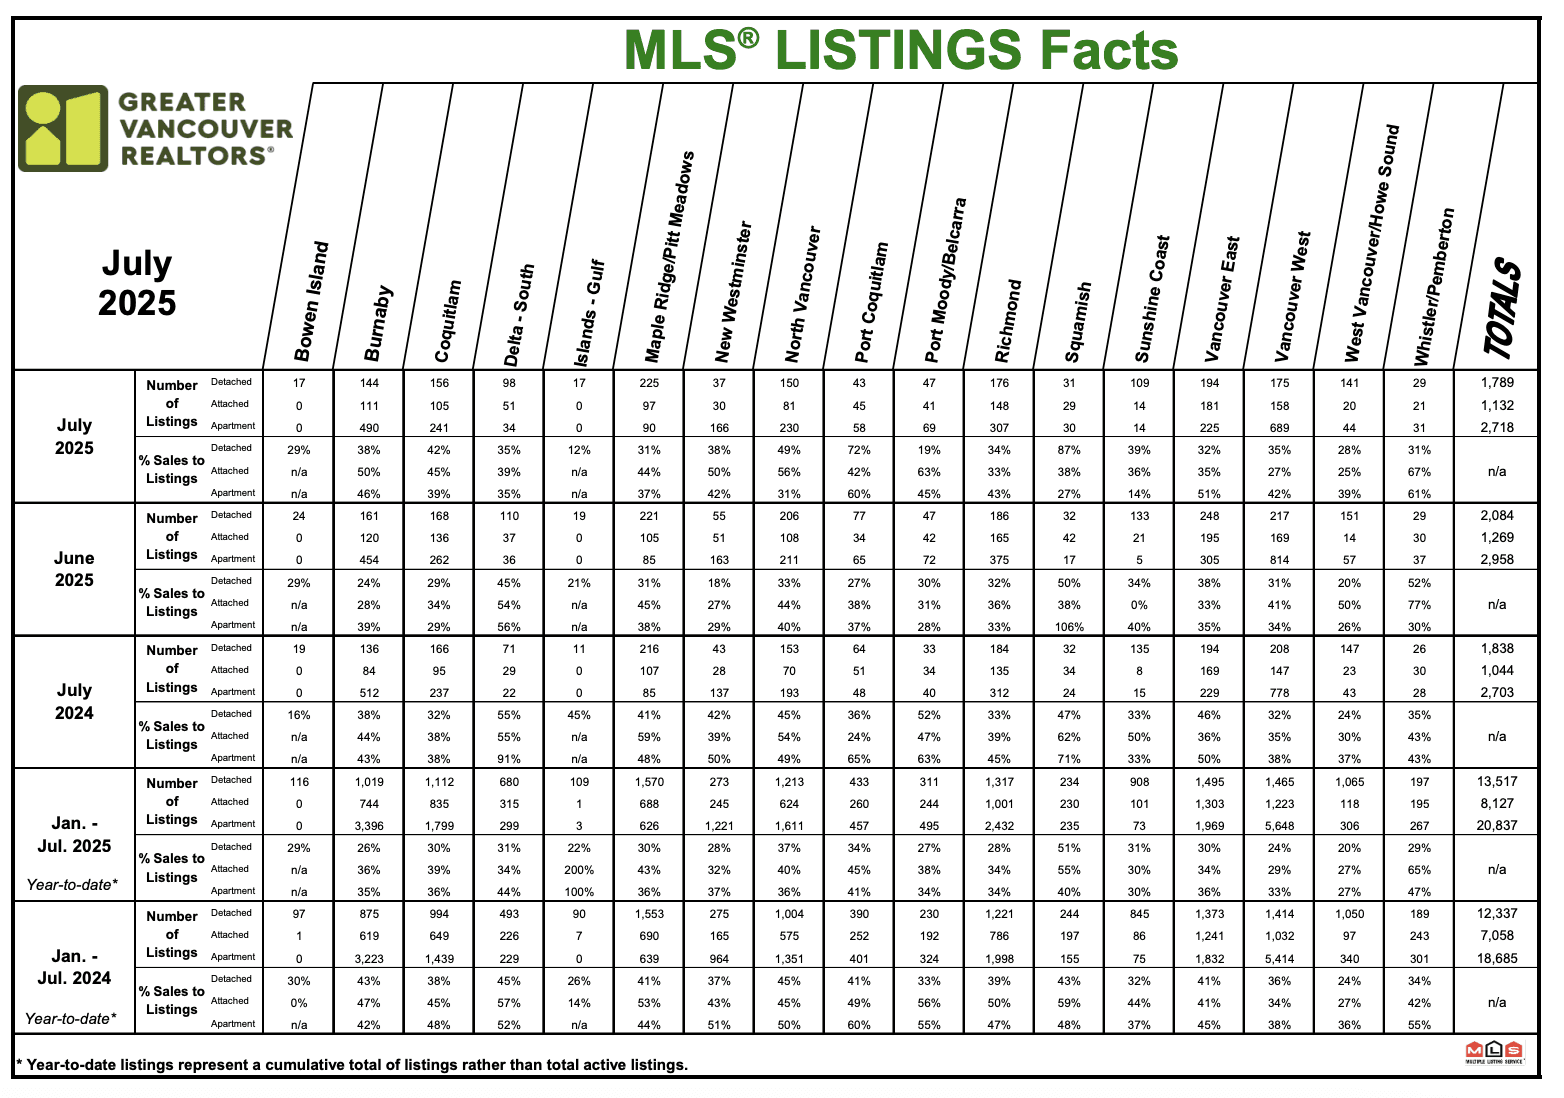
One thing is clear: buyers in Metro Vancouver have no shortage of homes to choose from this summer. Sellers listed 5,642 properties in July (detached, attached and apartments combined), a tad (+0.8%) more than a year ago. In fact, new listings outpaced the decade average by 12.4% – an unusual surplus of choice during what’s normally a sleepy summer stretch. This steady flow of listings kept total inventory hovering at comfortable levels. Active listings hit 17,168 in July, up nearly 20% year-over-year and a striking 40% above the 10-year norm. In plain English: the shelves are stocked.
With inventory stabilized around 17,000 homes, buyers have the upper hand in terms of selection. As Lis quipped, “this level of inventory provides buyers plenty of selection to choose from”. Properties aren’t flying off the shelf overnight; many are lingering a bit longer as shoppers take their time. The upside? More choice and less panic for those hunting for the perfect home. The downside (if you’re a seller)? You’ve got competition, and pricing is trending sideways for now.
Balanced Market Conditions: The Goldilocks Zone
July’s sales and inventory dance has landed us in a Goldilocks market – not too hot, not too cold. The sales-to-active listings ratio for all property types sat at 13.8% in July, smack in the middle of balanced-market territory. (For context: sustained dips below 12% tip the market in buyers’ favor, while bursts above 20% give sellers the upper hand.) At 13.8%, we’re gently favoring buyers, but it’s a far cry from the buyers’ market blues of late 2022.
By property type, the tale varies: Detached homes are moving at a 10.2% sales-to-listings ratio – a tad sluggish, bordering on a buyer’s market. Townhouses are doing better at 16.7%, and condos not far behind at 15.9%. This means townhomes and apartments are inching into stronger demand relative to supply, while detached houses languish a bit. Overall, though, the market’s temperature is moderate. There’s little pressure for prices to race upward or downward in the short term. As GVR’s analysis notes, with current conditions, home prices are likely to keep “trending sideways” as supply and demand remain relatively balanced.
Sellers shouldn’t get too complacent, however. If this sales recovery builds momentum (and with interest rates on hold, it just might), those ample inventories could start thinning. Lis cautions that if sales “accelerate, these favorable conditions for home buyers may begin slowly slipping away, as inventory levels decline and home sellers gain more bargaining power”. In other words, today’s balance could tilt tomorrow – the market seesaw is poised to pivot if demand heats up.
Price Trends and MLS® HPI: Sideways Shuffle Continues
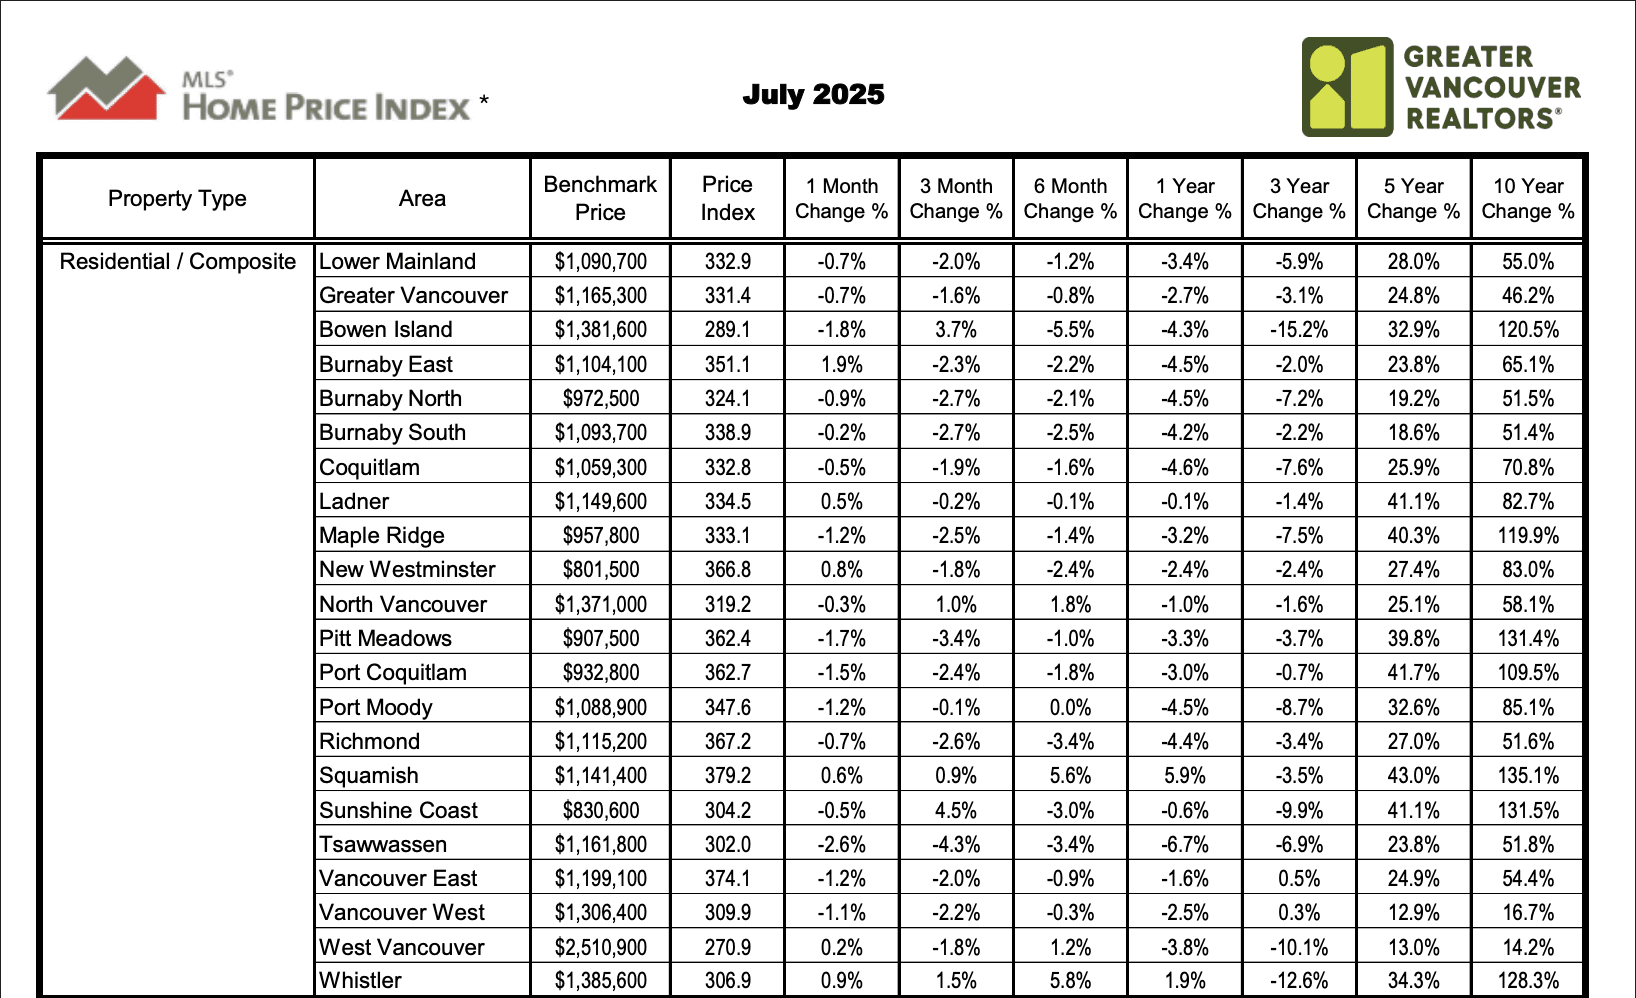
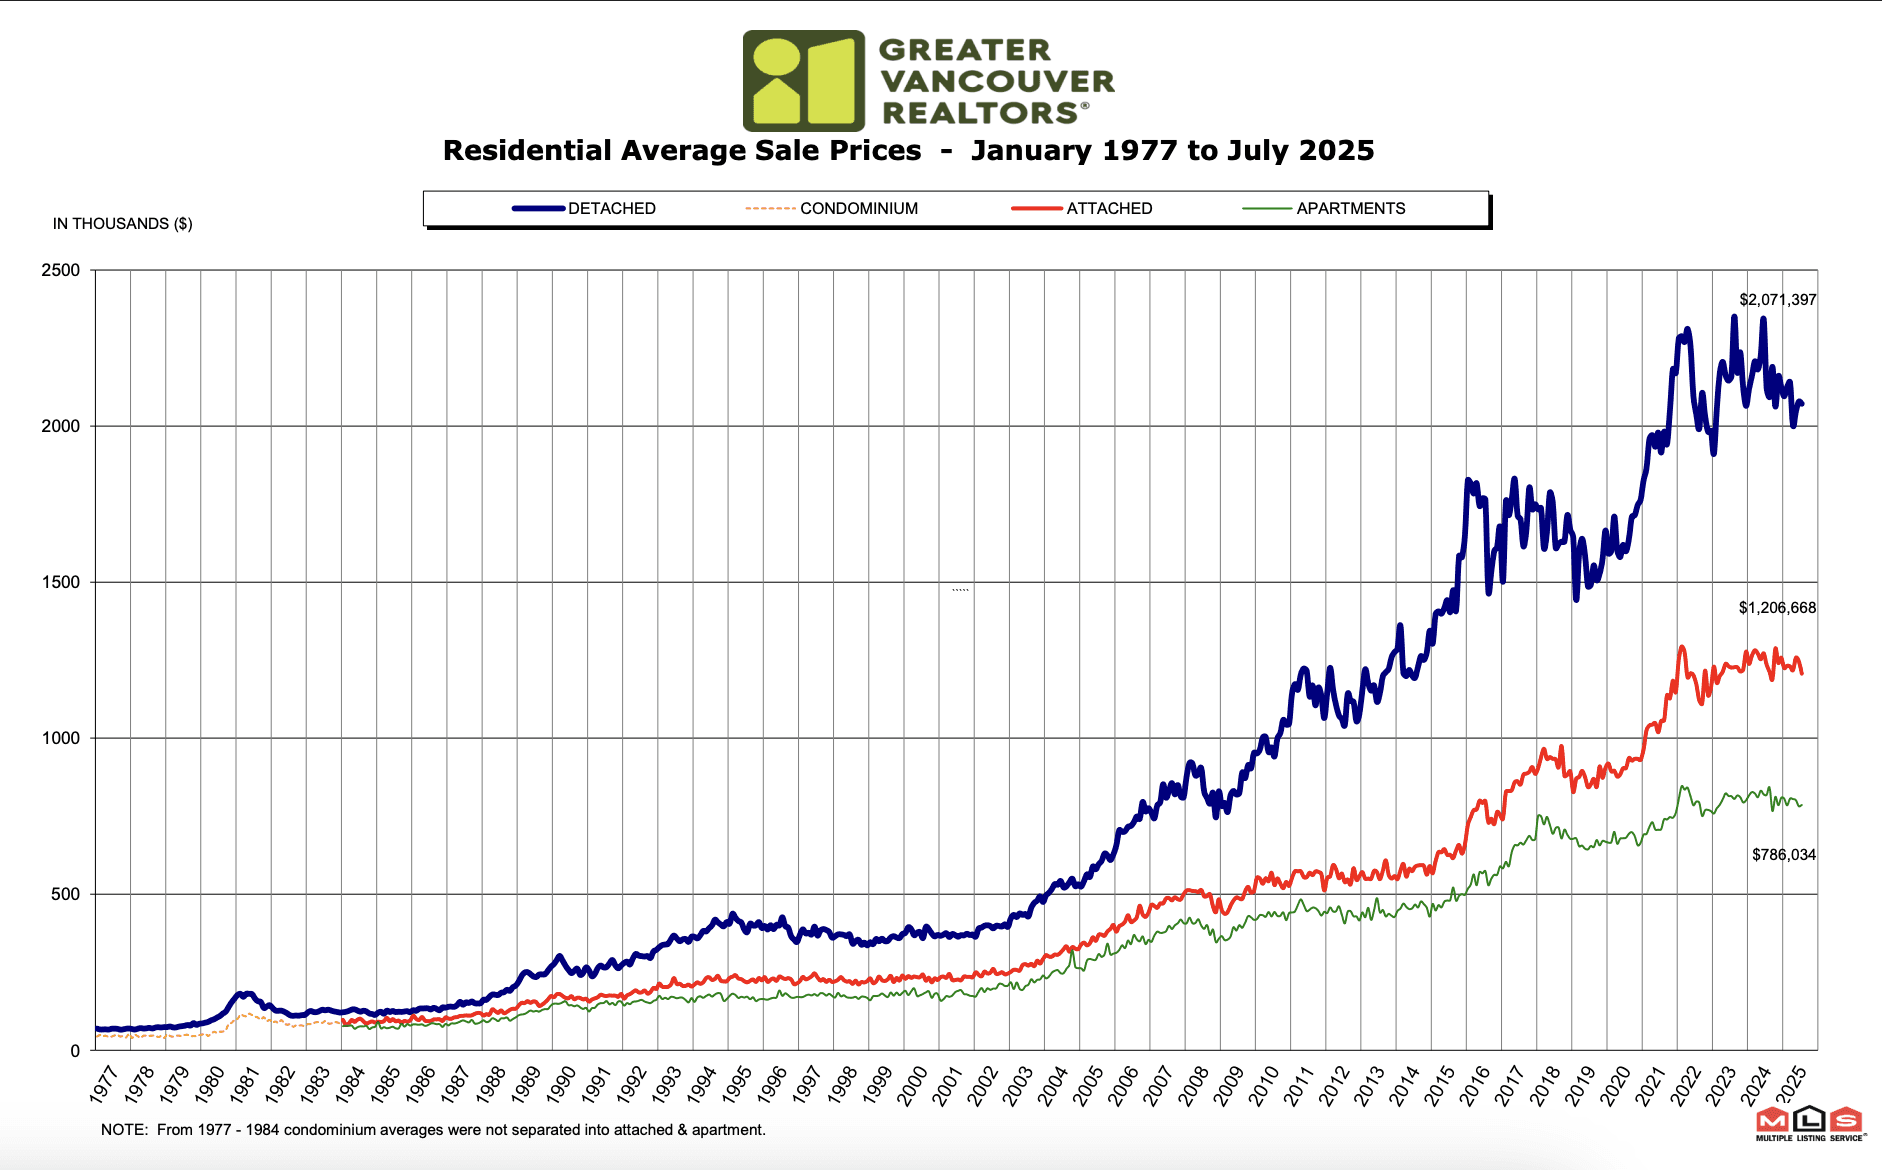
Prices across Greater Vancouver are doing a slow shimmy but no dramatic slides or spikes – think sideways shuffle. The MLS® Home Price Index (HPI) composite benchmark for all residential properties came in at $1,165,300 in July. That’s 2.7% lower than July 2024 (when the market was cooling) and 0.7% lower than just a month ago, June 2025. In other words, prices have inched down a bit, both year-over-year and month-over-month, reflecting the balanced conditions. We’re not seeing free-fall price drops – more like a gentle deflation of the pandemic price balloon.
Breaking it down by housing type, all segments saw modest price easing from last year:
Detached Homes: Benchmark price about $1.97 million, down 3.6% year-over-year (and off 1% from June month-over-month).
Townhomes (Attached): Benchmark around $1.099 million, down 2.3% year-over-year (and 0.4% below June levels).
Condominiums: Benchmark at roughly $743,700, down 3.2% year-over-year (and 0.6% lower than June 2025).
These declines aren’t exactly headline-grabbing – they’re more in line with a market that’s catching its breath. Prices have been drifting downward gently as higher interest rates throughout the year cooled purchasing power. The current balanced market is acting like a governor on price movements, preventing any wild swings. With inventory ample and sales moderate, “sideways” is the name of the game for pricing in the short term.
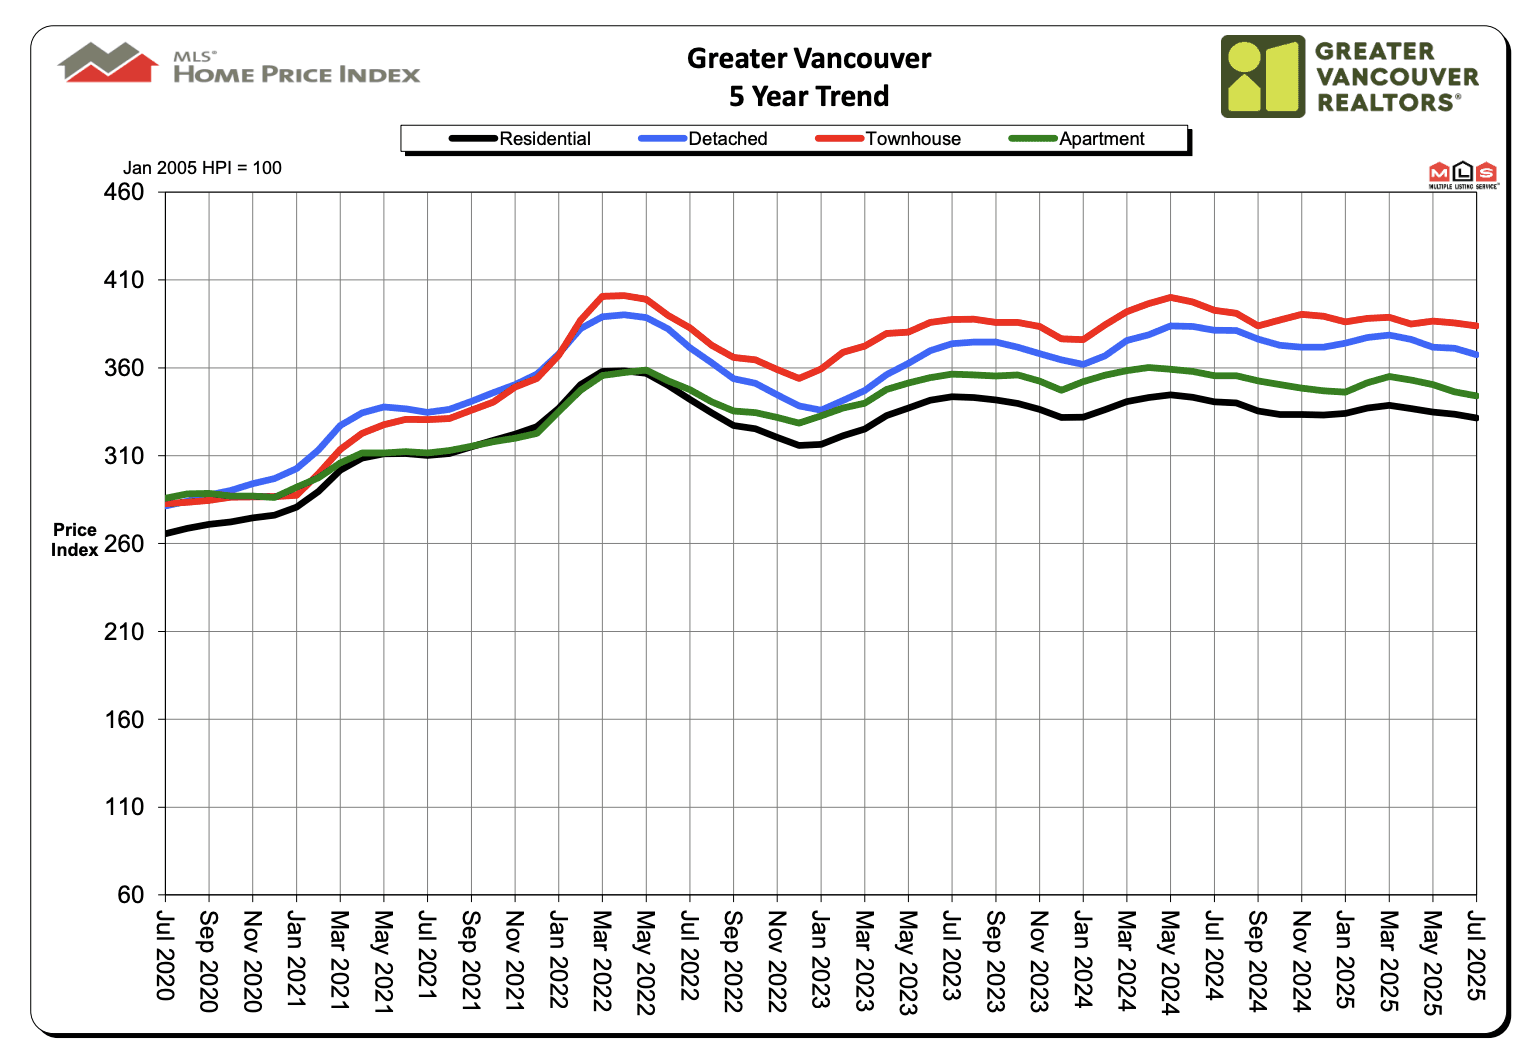
It’s worth noting that despite the recent softening, prices remain well above pre-pandemic levels (just check the 5-year and 10-year HPI changes – many areas still show double-digit percentage gains over that span). So, while July 2025’s benchmark is a notch below last year, homeowners who bought 5+ years ago are largely sitting on comfortable equity cushions.
Detached Homes: Luxury Lull and Suburban Surges
The detached-home market in Greater Vancouver is like an aging rock star playing a slower tune – still commanding attention, but with less frenzy than in its heyday. Detached sales tallied 660 in July, down 4.1% from the same month last year. Buyers remain price-sensitive at the top end, especially with a typical detached house costing just under $2 million on average. The benchmark price for a detached home was $1,974,400, 3.6% lower than July 2024 (and off 1% from June). So, values have slid a bit, but not a collapse – more like a controlled descent from 2022’s peak altitude.
Not all detached markets are equal, of course. Regional quirks abound:
In high-end enclaves like Vancouver’s West Side and West Vancouver, prices have softened the most. Vancouver West’s detached benchmark sits around $3.31 million (↓5.6% YoY), and West Vancouver’s is about $3.20 million (↓4.0% YoY) – significant annual declines, reflecting cautious luxury buyers.
Meanwhile, some suburban markets are holding steady or even up. For example, Burnaby East’s typical detached house is ~$1.95M, up a slight 0.5% from last year – essentially flat, but notable for bucking the regional trend. Ladner and New Westminster also saw detached prices flat-to-up marginally year-over-year (around +1%). And the award for hottest detached market goes to Squamish, where the benchmark soared to $1.69M – an 11.2% jump from last July. (Yes, you read that right: apparently everyone wants a piece of Squamish these days.)
On the flip side, markets like Coquitlam (~$1.74M, ↓5.1% YoY) and Tsawwassen (~$1.54M, ↓4.7% YoY) saw more pronounced annual price drops, reminding us that rising inventory and buyer caution are putting pressure on certain areas.
In terms of supply-demand balance, detached houses are the softest segment right now – with that 10.2% sales-to-active ratio, many listings aren’t exactly flying off the market. Buyers of detached homes have room to negotiate, and it shows. Sellers need to price sharp in this segment, or risk their home languishing while choosy buyers weigh their options.
Townhomes: The Comeback Kid of July
If any segment deserves a little gold star in July, it’s townhomes and other attached properties. Attached home sales reached 459 units, a 5% increase over July 2024. That’s right – sales up year-over-year, a rarity in recent times. Families priced out of the detached market and upsizers from condos are clearly finding townhouses the Goldilocks choice (more space, but not a $2M price tag). Even with that bump in sales, townhome inventory kept pace, and the benchmark price for townhouses dipped to $1,099,200, about 2.3% lower than last year (and 0.4% below June). In other words, townhomes got more affordable on an annual basis, even as more buyers snapped them up – a little summer sale for the savvy mid-market buyer.
The sales-to-active listings ratio for attached homes hit 16.7%, the highest among property types. That’s on the cusp of a seller’s market, indicating relatively robust demand. Townhouses are clearly in demand, but price growth remains modest to negative year-over-year, suggesting buyers still have the upper hand on pricing for now.
Regional performance for townhomes runs the gamut:
Some areas even saw slight price growth in townhouses. Check this: Coquitlam’s typical townhome (~$1.094M) is up about 0.2% year-over-year – essentially flat, but notable as an outlier of resilience. Likewise, Port Coquitlam’s townhouse prices are roughly flat to last year (+0.2% YoY). A few areas in Greater Vancouver managed to tread water or better in the attached segment.
Many other areas had mild declines, in the low-single-digit range, which is almost a rounding error in volatile Vancouver. Vancouver East townhouses, for instance, average ~$1.118M, down 2.4% YoY, and Vancouver West townhomes (~$1.417M) are down about 1.9% YoY. Small potatoes in the grand scheme.
Then there’s Richmond, which stands out for a bigger slide: typical townhome ~$1.094M, down 5.7% from last July. That’s one of the larger annual drops in the townhouse category, possibly reflecting higher supply or pushback on pricing in that market.
Overall, townhomes remain a bright spot: sales are up, and prices are only gently down. If the market recovery continues, townhouses could be poised to firm up first – the demand is clearly there.
Condos/Apartments: Solid Performance in the Middle
Condo hunters, take heart: the apartment market is holding its own in 2025’s balancing act. Sales of apartment units reached 1,158 in July, down a modest 2.9% year-over-year. Given how quiet the winter and spring were, that’s actually not a bad showing – condos are the entry point for many buyers, and activity is only slightly below last year’s pace. The benchmark condo price for Metro Vancouver is $743,700, about 3.2% lower than July 2024 (and down 0.6% from June). So, like the other categories, condos are a bit cheaper than a year ago, but we’re talking small single-digit shifts. The average condo owner isn’t sweating a 3% dip after the 20-30% surges of the pandemic era.
The condo market’s sales-to-listings ratio is 15.9%, right in balanced territory. Supply and demand for condos are pretty even, which explains the relatively flat price trend. No big run-ups, no big slumps – just a steady-as-she-goes vibe. For investors, condos are still attractive given persistent rental demand, and for first-time buyers, they remain the most accessible option (relatively speaking – $700k+ for a typical condo is still Vancouver).
Regional condo highlights:
The North Shore condo markets actually saw slight price increases year-over-year, defying the regional dip. North Vancouver’s typical condo (~$819,500) is up about 0.6% YoY, and West Vancouver’s (~$1.30M, luxury condos land) is up 1.4% YoY. These are small upticks, but notable since most areas fell a bit. It seems demand for condos in prime areas with limited supply (and downsizer appeal) has kept prices buoyant there.
Whistler also managed a slight increase, with condos up ~0.8% YoY – no surprise, as resort markets often dance to their own tune.
On the flip side, Tsawwassen condos took a hit: the benchmark condo price (~$651,600) plunged 7.3% year-over-year, one of the steepest drops region-wide. This could be due to a wave of new supply or simply less buyer interest out in South Delta’s apartment market.
Most other areas saw moderate declines. Burnaby and Coquitlam condos are generally down 4–5% YoY, and Surrey/White Rock (note: outside GVR jurisdiction) would likely show similar trends if included. Vancouver East & West condos both eased around 3.4% below last year’s values, roughly mirroring the regional average. No dramatic divergences in the city condo scene – it’s a consistent story of mild softening.
In summary, the condo market is stable as a table: plenty of sales, plenty of listings, and price changes that won’t make anyone spit out their coffee. If anything, buyers have a bit more negotiating power than last year, but don’t expect deep discounts on well-located units.
Regional Roundup: East vs. West, and the Suburbs
Real estate is always local, and Greater Vancouver’s July stats show significant variation by area. Here are a few standout regional trends from the MLS® Home Price Index data:
Vancouver East vs. Vancouver West: Both sides of the city saw overall benchmark prices slip a tad. East Van’s composite benchmark is about $1.20M (down 1.6% YoY), while Vancouver West’s is about $1.31M (down 2.5% YoY). In other words, east side, west side, all around town, prices are down a smidge – nothing dramatic. Detached homes bore the brunt of declines, as noted, whereas condo/townhouse segments in these areas are more stable.
Burnaby, Coquitlam, Richmond: These key suburbs all saw modest price corrections. For instance, Coquitlam’s composite benchmark ~$1.06M is down 4.6% YoY, and Richmond’s ~$1.115M is down 4.4% YoY. Burnaby is mixed: its East quadrant had a bigger dip (composite ↓4.5%), while South Burnaby and North Burnaby were closer to 4% down. These areas also carry higher inventory increases, which helped temper prices.
North Shore & Outlying Areas: The North Shore (North Van, West Van) held up relatively well in price trends. North Van’s composite HPI is off only ~1.0% YoY (buoyed by condo/townhome strength), and West Van’s is down 3.8% (mostly due to its pricy detached sector). Squamish and Whistler were the anomalies on the positive side: Squamish’s overall prices jumped ~5.9% YoY, and Whistler’s composite is up ~1.9% YoY. It appears those markets have unique demand drivers (lifestyle buyers, remote workers, etc.) that kept them rallying even as the rest of Metro Vancouver cooled.
Fraser Valley Adjacent (Maple Ridge, Sunshine Coast, etc.): In markets like Maple Ridge and Sunshine Coast, prices edged down slightly (~3% YoY declines for composite). These areas saw huge run-ups in the pandemic, so a bit of give-back is expected. Tsawwassen/South Delta stands out with a larger composite drop (~6.7% YoY), the biggest regional decline, showing that increased inventory there (and maybe buyer focus shifting back to core areas) put a damper on values.
Overall, Greater Vancouver’s summer market is a mosaic: some pockets up, many down a touch, but no area is witnessing anything too extreme. The widespread increase in inventory (+20% YoY region-wide) acted as a great equalizer, giving buyers in every neighborhood more choice and negotiating power than they had during the hyper-competitive markets of 2021-2022.
Shifts in Dynamics: Balance, Stability… For Now
The July 2025 data paints a picture of a market in relative equilibrium. Buyers are no longer in full retreat, and sellers are coming to terms with the new normal of higher interest rates. Sales volumes, while not exhilarating, are at least on par with last year’s and climbing off early-2025 lows, indicating a cautious recovery. Inventory has plateaued at a level high enough to keep price growth in check, but not so high as to trigger major price crashes. It’s a balanced tug-of-war – a bit of a stalemate where neither side has a clear upper hand.
Such stability is a double-edged sword. For buyers, especially those who struggled with rampant price increases in the past, this balance is a welcome relief. They have time to ponder decisions and perhaps even include an inspection clause (gasp). For sellers, it means adjusting expectations – homes won’t “sell themselves” at last year’s prices. Those realistic about pricing and willing to negotiate are still transacting; those holding out for 2022-style bidding wars may be left holding the bag.
Looking ahead, all eyes are on the Bank of Canada and the broader economy. The current balanced conditions rest on the assumption of stable borrowing costs. July’s rate pause was a gift to the market’s psyche. If interest rates stay steady (or even tick down in 2026), we could see buyers gain confidence, sales strengthen, and the pendulum start swinging back toward a seller’s market. In that scenario, today’s ample listings might start to dwindle and prices could firm up again – the “favorable conditions for home buyers may begin slipping away” if sales momentum builds.
Conversely, if economic clouds gather – say, inflation flares up or those “ongoing trade negotiations with the USA” mentioned by GVR hit a snag – uncertainty could keep a lid on demand. For now, though, Greater Vancouver’s real estate is enjoying a Goldilocks moment: not too hot, not too cold, just balanced enough that everyone can catch their breath. In a market known for wild rides, a little calm and comedy (however brief it may be) is almost a welcome change.
In short, July 2025 delivered a mildly encouraging report card for Greater Vancouver real estate: sales stabilizing, prices easing gently, and inventory providing a healthy buffer. It’s a market behaving rationally – who would’ve thought? Enjoy the equilibrium while it lasts, because in Vancouver, you never know when the winds will change. For now, both buyers and sellers can claim small victories, and that’s a win-win we don’t see very often.
Market Overview: Early Signs of a Comeback
Greater Vancouver’s housing market is showing hints of a summer revival – not a full-on frenzy, but certainly a step up from the spring chill. Home sales in July 2025 totaled 2,286, just 2% shy of July 2024’s level, confirming the “early signs of recovery” that started to emerge in June. This minor year-over-year dip is practically a rounding error considering sales had been lagging far worse earlier in the year. To put it in context, July’s sales were still about 13.9% below the 10-year average for the month – so while we’re off life support, we’re not doing cartwheels just yet.
What’s fueling this cautious comeback? For one, the Bank of Canada hit the pause button on rate hikes in July, offering buyers and sellers a breather. This policy hold “could help bolster sales activity by providing more certainty” around borrowing costs. Add a dash of pent-up demand and you get a modest summer uptick in home buying.
Inventory and New Listings: Plenty of Options for Picky Buyers
One thing is clear: buyers in Metro Vancouver have no shortage of homes to choose from this summer. Sellers listed 5,642 properties in July (detached, attached and apartments combined), a tad (+0.8%) more than a year ago. In fact, new listings outpaced the decade average by 12.4% – an unusual surplus of choice during what’s normally a sleepy summer stretch. This steady flow of listings kept total inventory hovering at comfortable levels. Active listings hit 17,168 in July, up nearly 20% year-over-year and a striking 40% above the 10-year norm. In plain English: the shelves are stocked.
With inventory stabilized around 17,000 homes, buyers have the upper hand in terms of selection. As Lis quipped, “this level of inventory provides buyers plenty of selection to choose from”. Properties aren’t flying off the shelf overnight; many are lingering a bit longer as shoppers take their time. The upside? More choice and less panic for those hunting for the perfect home. The downside (if you’re a seller)? You’ve got competition, and pricing is trending sideways for now.
Balanced Market Conditions: The Goldilocks Zone
July’s sales and inventory dance has landed us in a Goldilocks market – not too hot, not too cold. The sales-to-active listings ratio for all property types sat at 13.8% in July, smack in the middle of balanced-market territory. (For context: sustained dips below 12% tip the market in buyers’ favor, while bursts above 20% give sellers the upper hand.) At 13.8%, we’re gently favoring buyers, but it’s a far cry from the buyers’ market blues of late 2022.
By property type, the tale varies: Detached homes are moving at a 10.2% sales-to-listings ratio – a tad sluggish, bordering on a buyer’s market. Townhouses are doing better at 16.7%, and condos not far behind at 15.9%. This means townhomes and apartments are inching into stronger demand relative to supply, while detached houses languish a bit. Overall, though, the market’s temperature is moderate. There’s little pressure for prices to race upward or downward in the short term. As GVR’s analysis notes, with current conditions, home prices are likely to keep “trending sideways” as supply and demand remain relatively balanced.
Sellers shouldn’t get too complacent, however. If this sales recovery builds momentum (and with interest rates on hold, it just might), those ample inventories could start thinning. Lis cautions that if sales “accelerate, these favorable conditions for home buyers may begin slowly slipping away, as inventory levels decline and home sellers gain more bargaining power”. In other words, today’s balance could tilt tomorrow – the market seesaw is poised to pivot if demand heats up.
Price Trends and MLS® HPI: Sideways Shuffle Continues
Prices across Greater Vancouver are doing a slow shimmy but no dramatic slides or spikes – think sideways shuffle. The MLS® Home Price Index (HPI) composite benchmark for all residential properties came in at $1,165,300 in July. That’s 2.7% lower than July 2024 (when the market was cooling) and 0.7% lower than just a month ago, June 2025. In other words, prices have inched down a bit, both year-over-year and month-over-month, reflecting the balanced conditions. We’re not seeing free-fall price drops – more like a gentle deflation of the pandemic price balloon.
Breaking it down by housing type, all segments saw modest price easing from last year:
Detached Homes: Benchmark price about $1.97 million, down 3.6% year-over-year (and off 1% from June month-over-month).
Townhomes (Attached): Benchmark around $1.099 million, down 2.3% year-over-year (and 0.4% below June levels).
Condominiums: Benchmark at roughly $743,700, down 3.2% year-over-year (and 0.6% lower than June 2025).
These declines aren’t exactly headline-grabbing – they’re more in line with a market that’s catching its breath. Prices have been drifting downward gently as higher interest rates throughout the year cooled purchasing power. The current balanced market is acting like a governor on price movements, preventing any wild swings. With inventory ample and sales moderate, “sideways” is the name of the game for pricing in the short term.
It’s worth noting that despite the recent softening, prices remain well above pre-pandemic levels (just check the 5-year and 10-year HPI changes – many areas still show double-digit percentage gains over that span). So, while July 2025’s benchmark is a notch below last year, homeowners who bought 5+ years ago are largely sitting on comfortable equity cushions.
Detached Homes: Luxury Lull and Suburban Surges
The detached-home market in Greater Vancouver is like an aging rock star playing a slower tune – still commanding attention, but with less frenzy than in its heyday. Detached sales tallied 660 in July, down 4.1% from the same month last year. Buyers remain price-sensitive at the top end, especially with a typical detached house costing just under $2 million on average. The benchmark price for a detached home was $1,974,400, 3.6% lower than July 2024 (and off 1% from June). So, values have slid a bit, but not a collapse – more like a controlled descent from 2022’s peak altitude.
Not all detached markets are equal, of course. Regional quirks abound:
In high-end enclaves like Vancouver’s West Side and West Vancouver, prices have softened the most. Vancouver West’s detached benchmark sits around $3.31 million (↓5.6% YoY), and West Vancouver’s is about $3.20 million (↓4.0% YoY) – significant annual declines, reflecting cautious luxury buyers.
Meanwhile, some suburban markets are holding steady or even up. For example, Burnaby East’s typical detached house is ~$1.95M, up a slight 0.5% from last year – essentially flat, but notable for bucking the regional trend. Ladner and New Westminster also saw detached prices flat-to-up marginally year-over-year (around +1%). And the award for hottest detached market goes to Squamish, where the benchmark soared to $1.69M – an 11.2% jump from last July. (Yes, you read that right: apparently everyone wants a piece of Squamish these days.)
On the flip side, markets like Coquitlam (~$1.74M, ↓5.1% YoY) and Tsawwassen (~$1.54M, ↓4.7% YoY) saw more pronounced annual price drops, reminding us that rising inventory and buyer caution are putting pressure on certain areas.
In terms of supply-demand balance, detached houses are the softest segment right now – with that 10.2% sales-to-active ratio, many listings aren’t exactly flying off the market. Buyers of detached homes have room to negotiate, and it shows. Sellers need to price sharp in this segment, or risk their home languishing while choosy buyers weigh their options.
Townhomes: The Comeback Kid of July
If any segment deserves a little gold star in July, it’s townhomes and other attached properties. Attached home sales reached 459 units, a 5% increase over July 2024. That’s right – sales up year-over-year, a rarity in recent times. Families priced out of the detached market and upsizers from condos are clearly finding townhouses the Goldilocks choice (more space, but not a $2M price tag). Even with that bump in sales, townhome inventory kept pace, and the benchmark price for townhouses dipped to $1,099,200, about 2.3% lower than last year (and 0.4% below June). In other words, townhomes got more affordable on an annual basis, even as more buyers snapped them up – a little summer sale for the savvy mid-market buyer.
The sales-to-active listings ratio for attached homes hit 16.7%, the highest among property types. That’s on the cusp of a seller’s market, indicating relatively robust demand. Townhouses are clearly in demand, but price growth remains modest to negative year-over-year, suggesting buyers still have the upper hand on pricing for now.
Regional performance for townhomes runs the gamut:
Some areas even saw slight price growth in townhouses. Check this: Coquitlam’s typical townhome (~$1.094M) is up about 0.2% year-over-year – essentially flat, but notable as an outlier of resilience. Likewise, Port Coquitlam’s townhouse prices are roughly flat to last year (+0.2% YoY). A few areas in Greater Vancouver managed to tread water or better in the attached segment.
Many other areas had mild declines, in the low-single-digit range, which is almost a rounding error in volatile Vancouver. Vancouver East townhouses, for instance, average ~$1.118M, down 2.4% YoY, and Vancouver West townhomes (~$1.417M) are down about 1.9% YoY. Small potatoes in the grand scheme.
Then there’s Richmond, which stands out for a bigger slide: typical townhome ~$1.094M, down 5.7% from last July. That’s one of the larger annual drops in the townhouse category, possibly reflecting higher supply or pushback on pricing in that market.
Overall, townhomes remain a bright spot: sales are up, and prices are only gently down. If the market recovery continues, townhouses could be poised to firm up first – the demand is clearly there.
Condos/Apartments: Solid Performance in the Middle
Condo hunters, take heart: the apartment market is holding its own in 2025’s balancing act. Sales of apartment units reached 1,158 in July, down a modest 2.9% year-over-year. Given how quiet the winter and spring were, that’s actually not a bad showing – condos are the entry point for many buyers, and activity is only slightly below last year’s pace. The benchmark condo price for Metro Vancouver is $743,700, about 3.2% lower than July 2024 (and down 0.6% from June). So, like the other categories, condos are a bit cheaper than a year ago, but we’re talking small single-digit shifts. The average condo owner isn’t sweating a 3% dip after the 20-30% surges of the pandemic era.
The condo market’s sales-to-listings ratio is 15.9%, right in balanced territory. Supply and demand for condos are pretty even, which explains the relatively flat price trend. No big run-ups, no big slumps – just a steady-as-she-goes vibe. For investors, condos are still attractive given persistent rental demand, and for first-time buyers, they remain the most accessible option (relatively speaking – $700k+ for a typical condo is still Vancouver).
Regional condo highlights:
The North Shore condo markets actually saw slight price increases year-over-year, defying the regional dip. North Vancouver’s typical condo (~$819,500) is up about 0.6% YoY, and West Vancouver’s (~$1.30M, luxury condos land) is up 1.4% YoY. These are small upticks, but notable since most areas fell a bit. It seems demand for condos in prime areas with limited supply (and downsizer appeal) has kept prices buoyant there.
Whistler also managed a slight increase, with condos up ~0.8% YoY – no surprise, as resort markets often dance to their own tune.
On the flip side, Tsawwassen condos took a hit: the benchmark condo price (~$651,600) plunged 7.3% year-over-year, one of the steepest drops region-wide. This could be due to a wave of new supply or simply less buyer interest out in South Delta’s apartment market.
Most other areas saw moderate declines. Burnaby and Coquitlam condos are generally down 4–5% YoY, and Surrey/White Rock (note: outside GVR jurisdiction) would likely show similar trends if included. Vancouver East & West condos both eased around 3.4% below last year’s values, roughly mirroring the regional average. No dramatic divergences in the city condo scene – it’s a consistent story of mild softening.
In summary, the condo market is stable as a table: plenty of sales, plenty of listings, and price changes that won’t make anyone spit out their coffee. If anything, buyers have a bit more negotiating power than last year, but don’t expect deep discounts on well-located units.
Regional Roundup: East vs. West, and the Suburbs
Real estate is always local, and Greater Vancouver’s July stats show significant variation by area. Here are a few standout regional trends from the MLS® Home Price Index data:
Vancouver East vs. Vancouver West: Both sides of the city saw overall benchmark prices slip a tad. East Van’s composite benchmark is about $1.20M (down 1.6% YoY), while Vancouver West’s is about $1.31M (down 2.5% YoY). In other words, east side, west side, all around town, prices are down a smidge – nothing dramatic. Detached homes bore the brunt of declines, as noted, whereas condo/townhouse segments in these areas are more stable.
Burnaby, Coquitlam, Richmond: These key suburbs all saw modest price corrections. For instance, Coquitlam’s composite benchmark ~$1.06M is down 4.6% YoY, and Richmond’s ~$1.115M is down 4.4% YoY. Burnaby is mixed: its East quadrant had a bigger dip (composite ↓4.5%), while South Burnaby and North Burnaby were closer to 4% down. These areas also carry higher inventory increases, which helped temper prices.
North Shore & Outlying Areas: The North Shore (North Van, West Van) held up relatively well in price trends. North Van’s composite HPI is off only ~1.0% YoY (buoyed by condo/townhome strength), and West Van’s is down 3.8% (mostly due to its pricy detached sector). Squamish and Whistler were the anomalies on the positive side: Squamish’s overall prices jumped ~5.9% YoY, and Whistler’s composite is up ~1.9% YoY. It appears those markets have unique demand drivers (lifestyle buyers, remote workers, etc.) that kept them rallying even as the rest of Metro Vancouver cooled.
Fraser Valley Adjacent (Maple Ridge, Sunshine Coast, etc.): In markets like Maple Ridge and Sunshine Coast, prices edged down slightly (~3% YoY declines for composite). These areas saw huge run-ups in the pandemic, so a bit of give-back is expected. Tsawwassen/South Delta stands out with a larger composite drop (~6.7% YoY), the biggest regional decline, showing that increased inventory there (and maybe buyer focus shifting back to core areas) put a damper on values.
Overall, Greater Vancouver’s summer market is a mosaic: some pockets up, many down a touch, but no area is witnessing anything too extreme. The widespread increase in inventory (+20% YoY region-wide) acted as a great equalizer, giving buyers in every neighborhood more choice and negotiating power than they had during the hyper-competitive markets of 2021-2022.
Shifts in Dynamics: Balance, Stability… For Now
The July 2025 data paints a picture of a market in relative equilibrium. Buyers are no longer in full retreat, and sellers are coming to terms with the new normal of higher interest rates. Sales volumes, while not exhilarating, are at least on par with last year’s and climbing off early-2025 lows, indicating a cautious recovery. Inventory has plateaued at a level high enough to keep price growth in check, but not so high as to trigger major price crashes. It’s a balanced tug-of-war – a bit of a stalemate where neither side has a clear upper hand.
Such stability is a double-edged sword. For buyers, especially those who struggled with rampant price increases in the past, this balance is a welcome relief. They have time to ponder decisions and perhaps even include an inspection clause (gasp). For sellers, it means adjusting expectations – homes won’t “sell themselves” at last year’s prices. Those realistic about pricing and willing to negotiate are still transacting; those holding out for 2022-style bidding wars may be left holding the bag.
Looking ahead, all eyes are on the Bank of Canada and the broader economy. The current balanced conditions rest on the assumption of stable borrowing costs. July’s rate pause was a gift to the market’s psyche. If interest rates stay steady (or even tick down in 2026), we could see buyers gain confidence, sales strengthen, and the pendulum start swinging back toward a seller’s market. In that scenario, today’s ample listings might start to dwindle and prices could firm up again – the “favorable conditions for home buyers may begin slipping away” if sales momentum builds.
Conversely, if economic clouds gather – say, inflation flares up or those “ongoing trade negotiations with the USA” mentioned by GVR hit a snag – uncertainty could keep a lid on demand. For now, though, Greater Vancouver’s real estate is enjoying a Goldilocks moment: not too hot, not too cold, just balanced enough that everyone can catch their breath. In a market known for wild rides, a little calm and comedy (however brief it may be) is almost a welcome change.
In short, July 2025 delivered a mildly encouraging report card for Greater Vancouver real estate: sales stabilizing, prices easing gently, and inventory providing a healthy buffer. It’s a market behaving rationally – who would’ve thought? Enjoy the equilibrium while it lasts, because in Vancouver, you never know when the winds will change. For now, both buyers and sellers can claim small victories, and that’s a win-win we don’t see very often.


How Homes Work: Guides & Insights
Dive into guides that show what really matters in a house, from construction and materials to design choices and practical usability. Learn what questions to ask, what to watch for, and how to spot hidden issues so every feature—from tennis courts and home gyms to outdoor spaces and custom rooms—delivers the value it promises. These guides give the knowledge to assess every detail like an insider and avoid costly surprises.


Key Insights

Key Insights
Key Insights


Recent


Recent
Recent


Victoria Estate Digest is your Go-to source for In-Depth Real Estate Insights, Market Trends, and Expert Analysis in British Columbia.
We cover everything from Housing Affordability and Foreign Investment to Luxury Properties and Emerging Market Opportunities.
Whether you're a Buyer, Seller, or Investor, we provide the Research and Knowledge you need to navigate BC’s ever-changing Real Estate Landscape.